Tables, Not Tales: Building a Tiny Civilization in SQLite

Day 77 of 100 Days Coding Challenge: Python

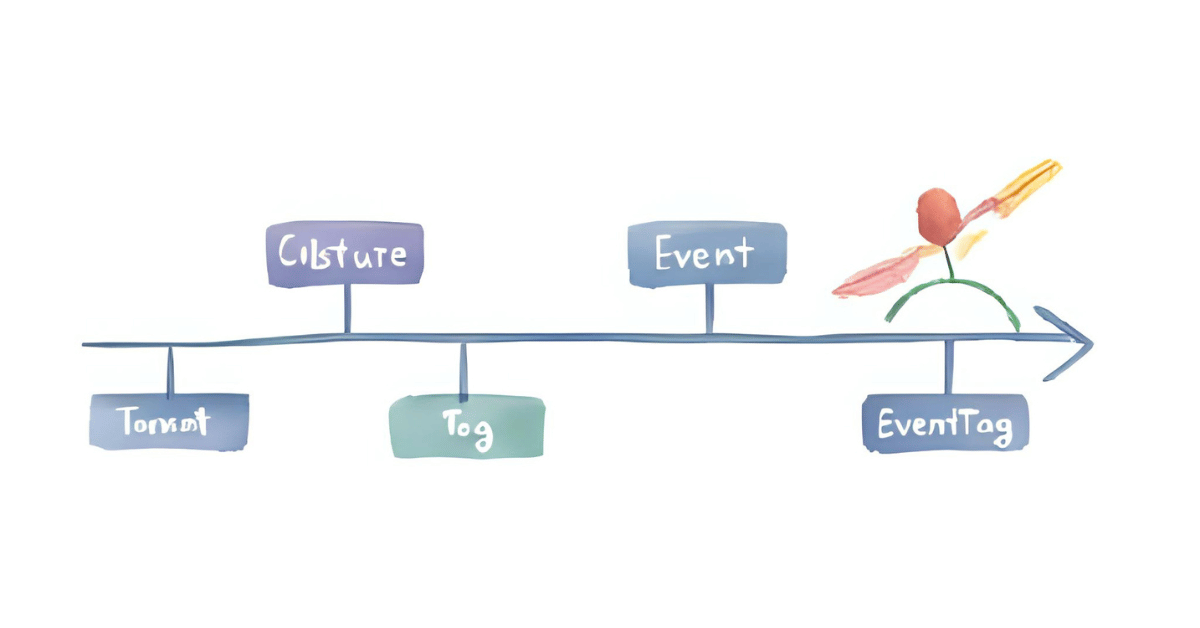
Today I put down the party streamers and picked up a blueprint. The job: lay the foundation for my Civilization Timeline app. On the menu were four tables—Civilization, Event, Tag, and the many-to-many glue EventTag—plus Alembic migrations and a tiny pytest to make sure I didn’t accidentally build a pyramid upside down.

This project has more moving parts than my last one, so I treated each step like crossing a rope bridge: slow, steady, and testing every plank. I reminded myself that I don’t need to understand every microscopic detail today; I just need to know why each step matters. With AI as my trail guide (and occasional comic relief), I focused on purpose over perfection—and got to a green “tests passed” without falling into the canyon.

Today’s Motivation / Challenge

Databases are the memory of an app. If I want timelines, comparisons, and “who overlapped whom,” I first need a clean vocabulary of things and relationships. Today’s work turns ideas into durable structures—like labeling boxes before you stack them in the attic, so Future Me doesn’t cry later.

Purpose of the Code (Object)

The code defines four tables—civilizations, events, tags, and the event-tag join—using SQLModel. Alembic migrations snapshot this structure so I can version changes safely. A simple pytest spins up a temporary database, runs the migration, and confirms the tables exist. If the test passes, my schema is real—not just a wish.

AI Prompt

(And we also recorded the Day 2 acceptance line in the project script: “Day 2 — Data model v1: Tables: civilizations, events, tags, joins. Use SQLModel + Alembic. Accept: migration creates tables; pytest -k ‘migrations’ passes.”)

Functions & Features

  • Define core schema with SQLModel: Civilization, Event, Tag.
  • Model many-to-many relationships via EventTag.
  • Set up Alembic and generate an initial migration.
  • Run a pytest that upgrades a fresh DB and asserts the four tables exist.

Requirements / Setup

  • Python 3.11+ recommended

Install basics:

pip install sqlmodel sqlalchemy alembic pytest

Environment:

# SQLite file location

setx DATABASE_URL “sqlite:///db/civ.db”   # (PowerShell: $env:DATABASE_URL = …)

Minimal Code Sample

# app/models/core.py

from typing import Optional, List

from sqlmodel import SQLModel, Field, Relationship

class EventTag(SQLModel, table=True):        # link table first so it’s importable

    event_id: int = Field(primary_key=True, foreign_key=”event.id”)

    tag_id:   int = Field(primary_key=True, foreign_key=”tag.id”)

class Civilization(SQLModel, table=True):

    id: Optional[int] = Field(default=None, primary_key=True)

    name: str; region: str

    start_year: int; end_year: Optional[int] = None

    events: List[“Event”] = Relationship(back_populates=”civilization”)

class Event(SQLModel, table=True):

    id: Optional[int] = Field(default=None, primary_key=True)

    civilization_id: int = Field(foreign_key=”civilization.id”)

    title: str; year: int

    civilization: Optional[Civilization] = Relationship(back_populates=”events”)

    tags: List[“Tag”] = Relationship(back_populates=”events”, link_model=EventTag)

class Tag(SQLModel, table=True):

    id: Optional[int] = Field(default=None, primary_key=True)

    name: str

    events: List[Event] = Relationship(back_populates=”tags”, link_model=EventTag)

Define the link table first; then reference it with link_model=EventTag for a clean many-to-many.

The Civilization Timeline Builder

Notes / Lessons Learned

  • I first tried adding __tablename__ like in raw SQLAlchemy. SQLModel didn’t appreciate that. Dropping __tablename__ and using table=True made everything click. Foreign keys then target the default singular table names (“civilization.id”, “event.id”, “tag.id”), which is tidy and predictable.
  • AI is a fantastic copilot—as long as I stay the pilot. When in doubt, I asked for small, verifiable steps and sanity checks. Explaining my error messages clearly got me faster, better fixes.
  • Alembic initialization matters. The one-liner alembic init alembic builds the right scaffolding. File structure isn’t ceremony—it’s how tools find each other.
  • A tiny gotcha: Alembic autogenerate used SQLModel’s AutoString in the revision, but the file only imported SQLAlchemy. Adding import sqlmodel at the top (or swapping AutoString for sa.String) fixed it. Another tiny snag: from __future__ import annotations must be first or not at all in migration files—easiest solution was to remove it.
  • Pytest wasn’t installed at first; the error reminded me. After installing, pytest -k “migrations” passed. The green check felt like a gold star sticker from elementary school—strangely motivating.

Optional Ideas for Expansion

  • Add seed scripts and CSVs (e.g., 10–12 major civilizations with a few events each) so the UI can show real bands tomorrow.
  • Introduce an enum (or controlled vocabulary) for event kinds and a couple of helpful indexes for faster filtering.
  • Write a second test that inserts a sample event with two tags and asserts the join table behaves as expected.

A New Project: Starting a Civilization Timeline Builder

Day 76 of 100 Days Coding Challenge: Python

Civilization Time Builder (Day 76 – Day 96)

When AI first suggested this project, I hesitated. The generated project plan was full of terms I barely understood. Take “Poetry,” for example. At first, it sounded like something Shakespeare might dabble in—but in reality, it’s a tool for managing Python dependencies. Once I looked it up and understood what it did, I decided to give it a try.

Environment management had been a thorn in my side during the Stock Tracker App Project. A single update to Python or one of its libraries could break everything I had built. I had already watched my programs collapse because of an accidental update. It was clear: if I wanted to build something more complex, I needed to learn a tool like Poetry. 

The theme of this project also pulled me in. It was all about history—a subject I’ve loved since childhood. I can still remember sitting in my parents’ library, leafing through their history books for hours. In that sense, this project felt tailor-made for me.

What excites me most is how expandable this program can be. I could easily adapt it into something larger, like mapping the timelines of Asimov’s Foundation series, Sanderson’s Stormlight Archive, or other Cosmere-related books.

That said, this was one of the toughest challenges I’ve faced so far. Some days I spent five or six hours just trying to fix problems. At one point, I almost quit altogether. But I kept going. Looking back, I’m glad I didn’t give up. Yes, I made plenty of mistakes—but each one taught me something valuable. If nothing else, I learned the importance of patience—with my code and with myself.

Experience

Today marked Day 1 of my shiny new project: the Civilization Timeline Builder. Finally, a project that ties together two of my favorite things—coding and history. The idea is to build an app that makes exploring history feel a little less like flipping through a dusty textbook and a little more like discovering buried treasure.

This project feels bigger than anything I’ve tackled before. Bigger data, bigger scope, bigger headaches. To avoid drowning in dependency drama, I brought in Poetry, my new virtual assistant. Poetry takes charge of libraries, versions, and packaging so I don’t end up in dependency jail. Think of it as a backstage manager who makes sure the actors (libraries) show up on time and don’t fight with each other.

The process, however, wasn’t like my earlier, simpler projects where I just spun up a virtual environment and carried on. Right away, I could sense something different. I usually code at an unholy hour of the morning, fueled by post-exercise clarity, but even then I had to stop and double-check every step. I even started a day early just to reread the instructions, as if I were reviewing the rules of an unfamiliar board game before play.

Today’s Motivation / Challenge

Why bother with all this fuss? Because Poetry is the difference between a messy desk covered in loose papers and a neat binder where everything is tabbed, labeled, and ready to go. Dependency management sounds boring—until it breaks. Then it’s all you think about. This project matters because it forces me to upgrade my tools and habits, making me a more organized (and hopefully less panicked) developer.

Purpose of the Code (Object)

The code for today doesn’t build empires or conquer continents just yet. Instead, it sets up a tiny FastAPI server with a health check and a stub of civilization data. It’s the scaffolding—the skeleton—upon which everything else will hang. Think of it as the tent poles before the circus begins.

Functions & Features

  • Start a FastAPI server with a health check endpoint.
  • Return a couple of sample civilizations from in-memory data.
  • Filter civilizations by region and year range.

Requirements / Setup

  • Python 3.13
  • Poetry (dependency management)
  • FastAPI, Streamlit, Uvicorn

Install Poetry’s deps via:

poetry install

Run the API:

poetry run uvicorn app.main:api –reload

Minimal Code Sample

from fastapi import FastAPI, Query

from typing import List, Optional

api = FastAPI(title=”CivTimeline API”)

@api.get(“/health”)

def health():

    return {“ok”: True}

CIVS = [

    {“id”: 1, “name”: “Roman Republic/Empire”, “region”: “Europe”, “start_year”: -509, “end_year”: 476},

    {“id”: 2, “name”: “Han Dynasty”, “region”: “East Asia”, “start_year”: -206, “end_year”: 220},

]

@api.get(“/civs”)

def list_civs(region: Optional[List[str]] = Query(None), start: int = -3000, end: int = 2000):

    # Filter civs by year and region

    return {“items”: [c for c in CIVS if c[“start_year”] <= end and c[“end_year”] >= start 

                      and (not region or c[“region”] in region)]}

A small API stub with civilizations you can query.

The Civilization Timeline Builder

Notes / Lessons Learned

This project began with a repo scaffold: Poetry + FastAPI + Streamlit. It quickly proved to be a different animal than the smaller projects I’d done before. Installing Poetry felt like watching paint dry—it took so long I thought I had failed. But once I checked, it was there, quietly waiting for me to notice.

Next came the .env and .env.example files, along with .gitignore. These guardrails saved me from committing private config files to git. I learned this lesson the hard way in a previous project, where I nearly exposed secrets before catching myself. A README was also added, though I’ll admit I skipped it at first and paid the price in confusion later.

Booting up the FastAPI and Streamlit stubs worked, but the process felt chaotic. Nothing was “normal” compared to my earlier projects. To cope, I broke the steps into tiny pieces and forced myself to ask “why” at each step. The trick is not to stay in “why mode” too long—you’ll skip something important. Next time, I’m making a checklist before indulging my curiosity.

Optional Ideas for Expansion

  • Add a proper database instead of temporary in-memory data.
  • Build a simple UI filter in Streamlit for regions and years.
  • Visualize civilizations on a timeline chart.

Build a Portfolio vs. Benchmark Chart in Python

Day 75 of 100 Days Coding Challenge: Python

Today marked the final lap of my stock tracker project. To finish strong, I added one last function: checking my portfolio against the S&P 500. Think of it like racing your homemade go-kart against a Formula 1 car—suddenly, you know where you actually stand.

Most people use the ticker ^GSPC as their yardstick for the S&P 500. It’s a tidy snapshot of large-cap U.S. stocks. But here’s the trick: it only makes sense to compare apples to apples. If your portfolio is tilted toward bonds, emerging markets, or your cousin’s hot crypto tip, the S&P might not be your best match. Personally, I balance stocks and bonds between 70/30 and 50/50, depending on the season (and, frankly, my mood).

If your portfolio consists solely of ETFs, you could use SPY (an ETF that tracks the S&P 500). Want to check your bonds? Try a bond index ticker like AGG. The idea is simple: know what game you’re playing before you brag about winning.

Today’s Motivation / Challenge

Why bother with this comparison? Flying blind in investing is like bragging about your marathon time without realizing you ran half the distance. Benchmarking grounds you. It tells you whether your “brilliant strategy” is actually brilliant—or if you’d have been better off just buying the index and going fishing.

Purpose of the Code (Object)

This function aligns your portfolio’s performance with a benchmark (such as the S&P 500) from a date you choose. It then tells you how much you gained, what your growth rate looks like over time, and how painful your worst dip was. Finally, it plots a simple graph so you can see who’s winning: you or the index.

AI Prompt

Add to show the portfolio’s performance with a benchmark.

Functions & Features

  • Compare your portfolio against a benchmark (default: S&P 500).
  • Print stats: total return, growth rate, and max drawdown.
  • Plot both curves on a chart starting at the same baseline.
  • Flexible benchmark (SPY, AGG, or any valid ticker).

Requirements / Setup

  • Python 3.10+

Install dependencies:

pip install yfinance matplotlib pandas

Minimal Code Sample

# Compare portfolio vs benchmark

port_ret = portfolio / portfolio.iloc[0] – 1

bench_ret = benchmark / benchmark.iloc[0] – 1

plt.plot(port_ret.index, (1 + port_ret) * 100, label=”Portfolio”)

plt.plot(bench_ret.index, (1 + bench_ret) * 100, label=”Benchmark”)

plt.legend()

plt.show()

Both lines start at 100, so you can see the race clearly.

Stock Tracker

Notes / Lessons Learned

This project was an absolute joy. Finance has fascinated me ever since my university days, when I was the nerd reading investment books for fun. Writing this code felt like merging that old passion with my new one: programming. There’s a strange comfort in watching your ideas become actual functions—little digital tools that reflect your understanding of the markets. I’m not a professional investor, but I can proudly say this project carries bits of my life’s learning stitched into its code.

Optional Ideas for Expansion

  • Add dividends into the calculation for a more realistic comparison.
  • Try benchmarking against multiple indexes at once (stocks, bonds, international).

Snowstorm Grocery Preparation and Smart Grocery Run: A Cozy Winter Survival Story

Brian’s fitness journal after a brain stroke

I was peacefully negotiating with my pillow when my wife—clearly operating on a higher level of meteorological awareness—declared that we needed to go grocery shopping immediately. Not later. Not “after coffee.” Now.

According to her internal weather radar (which, frankly, has an impressive accuracy rate after 20+ years in Canada), a snowstorm was approaching within one to two hours. She had already gone out for her morning exercise, assessed the atmospheric mood, and preemptively prepared the driveway like a seasoned general before battle. Snow shovels? Strategically placed. Access? Efficient. Husband? Still half asleep.

Naturally, I complied.

Still blinking like a confused owl, I grabbed the grocery list and collected our two empty gallon water bottles—because nothing says “adult responsibility” quite like remembering hydration logistics before a snowstorm. We usually shop in the evening, but venturing out in the morning felt oddly peaceful. To my surprise, the store was much quieter than expected. Either we were exceptionally early… or everyone else had already sensed the coming snow apocalypse.

My wife, ever the planner, had finalized the weekly menu by Thursday. This meant our grocery mission was less “wandering and wondering” and more “strategic acquisition.” We secured everything for the week, plus two fresh gallons of water—barely. The shelf was already looking suspiciously empty, a silent sign that others had also received the same snowy premonition.

We were, quite honestly, lucky.

The last time a major snowstorm visited, we were effectively trapped in our house for a week. Our home sits behind a steep hill that transforms into an icy boss-level obstacle the moment snow accumulates. Climbing it becomes less “going out” and more “mountaineering with groceries.”

When we returned home, our cat was stationed at the window like a tiny, furry security officer on duty. Her head popped up the moment she spotted us, eyes wide with the dramatic concern of someone who clearly believed we had been gone for years rather than minutes. She often waits there whenever we leave, supervising our life choices from behind the glass.

By then, the snow had already begun—light at first, almost polite. But as we settled back inside, it quickly grew more confident, blanketing the area with over an inch of snow.

In retrospect, our early grocery expedition was not just productive. It was heroic. Or at least strategically wise.

Now the real question is Monday.

Artemis has her spay surgery scheduled, and we are quietly hoping the roads will cooperate. If not, we may once again find ourselves negotiating with snow, hills, and fate. But for now, we are stocked, prepared, and safely indoors—exactly where one should be when winter decides to make an entrance.

Managing Pet Appointments and Weather Uncertainty

Brian’s fitness journal after a brain stroke

Today, we took our cat to the vet right after my wife finished work. She left about fifteen minutes early—with her boss’s permission—so we could get there before the weather potentially turned messy. The lab work was originally set for Saturday, but after checking the forecast, my wife rescheduled it. If the weather plans to be dramatic, we prefer to be strategic.

Our cat, however, strongly disagreed with this strategy.

The moment we placed her in the carrier, she protested as if we had personally betrayed her trust. In her ideal world, the day should involve toys, admiration, and uninterrupted play—not a trip to the vet. Instead, she traveled like a very vocal, very fluffy prisoner of circumstance.

At the clinic, the lab assistant gently took her inside while we waited. A short time later, the technician returned with an amusing observation: our kitten willingly went back into her carrier during the lab work. Apparently, medical tests rank higher on her list of displeasure than the carrier itself. When she saw us again through the mesh, her mood improved instantly, as if we had heroically rescued her from a grave injustice.

Much of the conversation at the clinic revolved around the incoming weekend weather. My wife has been especially mindful of it. She even took a day off to manage the appointment.

We asked the receptionist whether the schedule might change because of the weather, and she said they would monitor conditions. The uncertainty grows because the main road near our home still has a barricade. If it stays closed, we will have to use the back roads, which are hilly and far less comforting in snow or ice.

The moment we got home, our kitten returned to her cheerful self, as if she had forgotten the entire veterinary visit. Freedom, it seems, fixes most grievances.

At least the lab work is done, which removes one major concern. Now we watch the forecast and hope the weather behaves so her surgery can proceed as planned.

Create a Simple Stock Decision Engine in Python

Day 74 of 100 Days Coding Challenge: Python

Today, I stitched everything together like a quilter finishing the last patch on a very geeky blanket. The goal? Use all the functions I’ve built over the past weeks to create a final recommendation system. In short: should I add more shares or just sit tight? My app only deals with the stocks I’m already tracking—no wild goose chase across the market. I did toy with the idea of building a “stock-hunting” feature, but that’s a whole different adventure, so I shelved it for another program.

My portfolio is more of a carefully balanced meal than a buffet. I keep a 30/70, 40/60, or 50/50 mix between bonds/fixed income and stocks, adjusting when it feels right. Bonds are split across short- and long-term, while stocks get divided across sectors. Truth be told, half my holdings still cluster around a few sectors, but that’s the nature of my investing style. I’m not a daily trader. I just invest systematically every week and let time do the heavy lifting.

Every function in this app was designed to reflect my method—slow, steady, and structured. Today marks the final “core” function. Tomorrow, I’ll wrap up with one last extra flourish before calling this project done.

Today’s Motivation / Challenge


Think of this function as the “gut check” before you hit the buy button. Instead of relying on hunches, it gathers what I’ve already built—momentum, RSI, moving averages—and asks: “Does this stock deserve more of your money?” It’s like having your own personal investment butler who politely says, “Perhaps not today, sir.”

Purpose of the Code (Object)


This function pulls together signals from multiple indicators and summarizes them into a simple recommendation. No complex trading strategy here—just a handy way to see whether your portfolio needs a nudge or if you’re better off staying put.

AI Prompt


Create a summary of multiple indicators and create a simple recommendation. 

Functions & Features

  • Combines RSI, moving average, and momentum signals.
  • Generates a simple “buy/hold” style recommendation.
  • Focuses only on stocks already in your portfolio.

Requirements / Setup

pip install yfinance pandas matplotlib numpy

Minimal Code Sample

def buy_suggestion():

    rsi = show_rsi_status()

    ma  = moving_average_tracker()

    mom = show_momentum_score()

    # Combine indicators → final suggestion

    print(“Recommendation: adjust or hold?”)

It just compiles all the signals into one place, like a referee calling the final play.

Stock Tracker

Notes / Lessons Learned


Adding this wasn’t actually difficult—the hard work was already done in the earlier functions. This was like putting the roof on a house after weeks of hammering walls together. I was pleasantly surprised by how satisfying it felt to see the app give me a neat, cohesive recommendation. It reminded me of my other homemade projects—whether yogurt, kombucha, or bread, you know exactly what went into it, and you can trust the result. That same sense of control made this feature feel “just right.”

Optional Ideas for Expansion

  • Add a “stock scout” function to suggest new tickers to track.
  • Layer in news headlines for context with the numbers.
  • Export recommendations to a CSV for record-keeping.

Build a Portfolio ‘What-If’ Simulator in Python

Day 73 of 100 Days Coding Challenge: Python

Today, I added a simulator that answers the age-old investor’s question: “What if I had bought back then?” This little time machine lets me track the profit and loss if I invested on a specific date. Now, I’m not the kind of person who enjoys crying over missed opportunities (I don’t keep a framed photo of Bitcoin circa 2012 on my wall), but this tool is less about regret and more about feedback.

It’s a way to run “what-if” experiments—like the financial version of those alternate timeline episodes in sci-fi shows. Did my stock beat the Nasdaq? Was it just riding the wave of its sector, or did it genuinely outperform? Did this one brilliant pick offset that other… not-so-brilliant one?

Of course, the analysis could get fancier if I tossed in transaction fees, taxes, dividends, and maybe even margin interest. But for now? I’m thrilled that my simulator is alive, kicking, and handing me numbers without judgment.

Today’s Motivation / Challenge

Everyone has had that “If only I had invested sooner…” thought. This project turns that into something useful rather than depressing. It’s like a personal coach reminding you: “Hey, hindsight is free—use it to plan your next move.”

Purpose of the Code (Object)

This function calculates how much money your investment would be worth today if you had dropped a certain amount into your chosen stocks on a specific past date. It doesn’t predict the future; it simply tells you how different entry points would have played out.

AI Prompt

Make it cleaner.
Please add the following function to the script:
Profit and loss if you invested on a chosen day.

Functions & Features

  • Add and remove stock symbols
  • Fetch and display real-time prices
  • Run simulations: X days ago or from a specific date
  • Calculate portfolio profit and loss over time
  • Rank best and worst performers

Requirements / Setup

  • Python 3.10+

Libraries:

pip install yfinance pandas matplotlib

Minimal Code Sample

closes = pd.to_numeric(closes, errors=”coerce”).dropna()

if isinstance(closes, pd.DataFrame):

    closes = closes.squeeze()  # flatten edge case

first_close = closes.iloc[idx:idx+1].to_numpy().item()

last_close  = closes.iloc[-1:].to_numpy().item()

This ensures you get true Python floats, not pandas Series objects that trigger warnings.

Stock Tracker

Notes / Lessons Learned

Remember the pandas deprecation I grumbled about yesterday? Well, it came back for an encore. Turns out float(closes.iloc[idx]) works fine—until pandas decides it doesn’t. My fix was to extract scalars with .to_numpy().item(). It’s one of those small but mighty changes that make the difference between smooth sailing and cryptic warnings.

To be honest, I wouldn’t have solved this one on my own without some outside nudges. But now both simulators (menu 10 and the shiny new “from date” feature) run clean. The app feels less like a prototype and more like a portfolio time machine.

Optional Ideas for Expansion

  • Add a benchmark comparison (e.g., against the S&P 500).
  • Layer in dividends and transaction costs for realism.
  • Simulate dollar-cost averaging for the cautious investor.

How a Winter Storm Disrupted Our Vet Plans and Daily Schedule

Brian’s fitness journal after a brain stroke

Nashville is preparing for an unusually dramatic ice rain storm, and, like any good plot twist, it has immediately begun rearranging our carefully planned schedule.

Today, we rescheduled Artemis’s vet appointment. She has a screening examination before her spaying surgery on Monday, which is already stressful enough without adding meteorological chaos into the mix. The original appointment was set for Saturday, but unfortunately.

Tennessee, charming as it is, is not exactly famous for its snow-handling infrastructure. A single hint of ice and the entire transportation system behaves like a startled cat. To make matters more complicated, the main road near our house is currently barricaded, leaving us with the scenic (and alarmingly hilly) back road as our only route to the vet. My wife mentioned that one of her colleagues had an accident on that very road years ago due to slippery conditions. Comforting information, truly.

Snow Preparation

We were originally expecting snow on Friday, so my wife—who approaches weather like a seasoned general—asked me on Thursday afternoon if I could take her after work. She even negotiated leaving fifteen minutes early with her boss, who agreed immediately.

Now, the real uncertainty lies with Monday. Artemis’s surgery may or may not proceed depending on how severe the weather becomes. Snow in Nashville is not just snow; it is an existential logistical challenge. A few years ago, a storm trapped us at home for over a week because the steep hill in front of our house turned into a skating rink.

Naturally, my wife—being from Canada—has already taken preventative measures. She salted our driveway and even lightly salted the road in front of the house.

We are also planning a grocery trip on Saturday morning, just in case the storm decides to overachieve. Meanwhile, my sister, who lives an hour away, has purchased a sled in preparation, which feels both practical and slightly theatrical.

Interestingly, while my wife is perfectly comfortable driving in snow due to her Canadian background, she insists that the real danger here is not the snow itself—but the roads and the drivers.

So, for now, we wait, we prepare, and we politely negotiate with the weather—because in Nashville, a winter storm does not just change the forecast. It rewrites the entire weekly schedule.

How to Find the Worst-Performing Stocks in Your Portfolio Using Python

Day 72 of 100 Days Coding Challenge: Python

Yesterday, I was busy shining the spotlight on my star performers—the stocks that strutted across the stage as Broadway leads. Today, it was time to peek behind the curtain and see who was tripping over their own shoelaces. Enter: the “Worst-Performing Stock Tracker” function.

The logic is the same as yesterday’s “Best Performer” feature, but instead of crowning heroes, this one identifies the stragglers. Why bother? Because good portfolio management isn’t just about celebrating your winners—it’s also about recognizing when something is quietly dragging you down. I use it as a reminder to rebalance, pairing losses with gains. Thanks to yesterday’s groundwork, adding this feature felt like running downhill instead of uphill.

Today’s Motivation / Challenge

This project matters because no portfolio is a utopia of green arrows. Every investor has that one stock sitting in the corner sulking, ruining the vibe. By building a tool that identifies these underperformers, you can make better decisions: cut your losses, reallocate funds, or at least brace yourself with an extra cup of coffee before checking your account.

Purpose of the Code (Object)

The code checks your portfolio over the past X days (7, 14, or 30) and identifies the worst performer. It then neatly lists the bottom 10, so you can see at a glance which ones are dragging your imaginary—or real—portfolio down. Think of it as a “naughty list” for your investments.

AI Prompt

Add a function to show Worst Performer (last X days). Identify the stock dragging your (imaginary) portfolio down and display the bottom 10 over 7, 14, or 30 days.

Functions & Features

  • Add, remove, and view tracked stocks.
  • Fetch real-time prices.
  • Check best and worst performers over selectable periods.
  • Simulate portfolio performance and rebalance strategies.

Requirements / Setup

  • Python 3.9+

Install dependencies:

pip install yfinance pandas matplotlib

Minimal Code Sample

def worst_performer_last_x_days(symbols, days=7):

    results = []

    for sym in symbols:

        closes = _get_closes_1d(sym, period_days=days+5)

        if closes is None or len(closes) < days + 1:

            continue

        start, end = float(closes.iloc[-(days+1)]), float(closes.iloc[-1])

        pct = (end – start) / start * 100

        results.append({“symbol”: sym, “pct”: pct})

    return sorted(results, key=lambda r: r[“pct”])[:10]  # bottom 10

This function sorts your portfolio by performance and hands you the 10 worst offenders.

Stock Tracker

Notes / Lessons Learned

I made sure the function pulls from the same stocks.json file used by other features, keeping everything consistent. That’s like making sure all your socks match before heading out—details matter.

What surprised me? Debugging an error in my “simulate portfolio value” function. I suspect it’s tied to the line grabbing the first close price, but that’s a mystery for another day. The fun (and slightly maddening) part of coding is how today’s victory sometimes reveals tomorrow’s bug. Keeps life interesting, doesn’t it?

Optional Ideas for Expansion

  • Add a “Worst Sector” view to see which industry is letting you down the most.
  • Build a feature that pairs losers with winners for auto-rebalancing.
  • Compare your bottom 10 to the S&P 500 and see if misery loves company.

Build a Portfolio Performance Checker in Python

Day 71 of 100 Days Coding Challenge: Python

Today, I added a feature to crown the “best performer” from my portfolio. Think of it as a mini award ceremony where only stocks are invited and there’s no acceptance speech—just numbers. The function itself is simple: it checks which stocks in my holdings have gained the most over the last 7, 14, or 30 days. I don’t need this every day; daily stock swings are more like background noise than useful insight. In fact, when I first started, I used to check every single day—bad idea. The constant up-and-down did nothing but feed my anxiety. Now, I prefer to take a step back and do a weekly review, usually on weekends. That’s when I reflect, think strategically, and make any adjustments.

I’m more of a mid-term investor, not a hyperactive day trader, so this tool fits right into my rhythm. It’s like glancing at the scoreboard after a few innings rather than obsessing over every pitch.

Today’s Motivation / Challenge


The challenge was to build a function that helps me zoom out. Beginners (my past self included) often get caught up in every twitch of the market. But sometimes, what you need is a bird’s-eye view: Which of my stocks has been pulling its weight lately? This function answers that without the clutter of daily drama.

Purpose of the Code (Object)


This code identifies which stock in your portfolio had the biggest gain over a chosen period—7, 14, or 30 days. It’s essentially a quick performance check-up for your holdings, designed to keep you focused on trends rather than noise.

AI Prompt


Use the file uploaded, and add the function to see Best Performer (last X days): Identify the top gainer over the last 7, 14, or 30 days.

Functions & Features

  • Add and remove stock symbols from your portfolio
  • Track daily changes and simulate allocations
  • Plot historical charts and moving averages
  • Check diversification and sector exposure
  • New: Spot the best performer over 7, 14, or 30 days

 You’ll need Python 3 and a few common libraries:

pip install yfinance pandas matplotlib

Minimal Code Sample

winner, results = best_performer_last_x_days(symbols, days=7)

print(f”Best performer (7 days): {winner[‘symbol’]} {winner[‘pct’]:.2f}%”)

This snippet finds the top gainer in your current portfolio over the past 7 days.

Stock Tracker

Notes / Lessons Learned


Today, I learned how a tiny inconsistency can wreak havoc. My script is now over 1,300 lines, and I initially got nothing but “no results” because the function was pulling symbols from the wrong place. I mistakenly used get_symbols() from portfolio.json, while the rest of the app stores tickers in stocks.json through load_stocks(). Naturally, the poor function came up empty. The quick fix was to swap in load_stocks(). It reminded me of those group projects where one person keeps using a different spreadsheet version—chaos ensues. Moral of the story: keep your files consistent, keep your sanity intact.

Optional Ideas for Expansion

  • Add a “Worst Performer” twin function, so you know which stock deserves detention.
  • Compare your portfolio’s best performer against the S&P 500 for context.
  • Create a simple chart that ranks the top 5 movers for a more visual snapshot.