
Day 67 of 100 Days Coding Challenge: Python
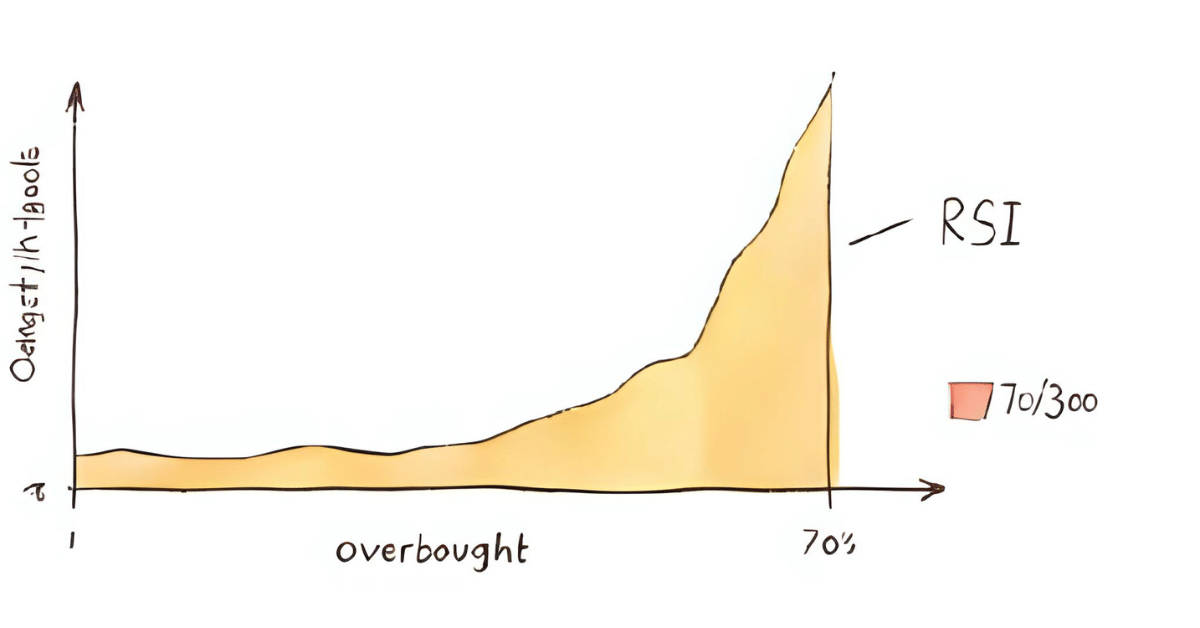
Today’s experiment was all about giving my stock tracker a sixth sense—adding the Relative Strength Index (RSI), RSI Stock Indicator . Think of RSI as the mood ring of the trading world: if it reads over 70, your stock might be partying too hard and due for a hangover (price pullback). Under 30? That’s the sulking, underappreciated stock that might be ready to rally.
Now, RSI isn’t the crystal ball some traders wish it was, but it’s a handy companion—especially when paired with the moving average I added yesterday. It’s popular for a reason: it’s simple, visual, and just a little bit addictive. The fun part is seeing it tell a different story than the price chart itself, which feels a bit like watching a behind-the-scenes documentary instead of just the movie.
Today’s Motivation / Challenge
I wanted to give my tracker more “personality” by adding an indicator that can hint when prices might reverse. Also, part of me just wanted to prove to myself that I could wrestle with the math, the formatting, and Yahoo Finance’s occasional mood swings—and win.
Purpose of the Code (Object)
This code calculates the RSI for each stock I’m tracking, then tells me whether each one might be overbought, oversold, or just sitting in the middle lane. It takes the raw price data, does a little statistical gymnastics, and spits out a number that’s easy to read, even if you’ve never taken a finance class.
AI Prompt
Add an RSI tracker to my existing Code
Functions & Features
- Calculate the 14-day RSI for each tracked stock.
- Flag stocks as overbought (≥70), oversold (≤30), or neutral.
- Handle messy or missing data without breaking the whole program.
Requirements / Setup
- Python 3.x
- pip install yfinance pandas numpy matplotlib
Minimal Code Sample
def _compute_rsi(series, period=14):
delta = series.diff()
gain = delta.clip(lower=0)
loss = -delta.clip(upper=0)
avg_gain = gain.ewm(alpha=1/period, adjust=False).mean()
avg_loss = loss.ewm(alpha=1/period, adjust=False).mean()
rs = avg_gain / avg_loss
return 100 – (100 / (1 + rs)) # RSI formula
Calculates the RSI from closing prices using Wilder’s smoothing.
Notes / Lessons Learned
If there’s one thing RSI taught me, it’s that the market isn’t the only thing that can get moody—code can too. I ran into a storm of “err arg must be…” errors when pandas didn’t like the format of the data coming from Yahoo Finance. It wasn’t just the low-volume ETFs either; even TSLA decided to throw a tantrum. I tried to fix it, and in the process, managed to break other parts of my program.
After a frustrating 150 minutes of debugging, I threw in the towel and started fresh. One hour later—miracle!—it worked. The fixes? Making value conversions safer, checking Series length before indexing, and printing clear error messages. Then came the “not 1-D” ambush—some tickers return MultiIndex columns, which threw my code into existential crisis. The solution was to always extract a clean 1-D float series before running calculations. Now it runs without cryptic complaints, and I finally feel like I’ve tamed it… for now.
Optional Ideas for Expansion
- Plot RSI alongside the price chart for a quick visual check.
- Let the user choose the RSI period length (not just 14 days).
- Add alerts for when a stock crosses the overbought/oversold thresholds.