Day 43 of 100 Days Muscle Resistance Workout Challenge
Focus Topic: Learn what progressive overload means, gradually increasing weight, reps, or intensity to stimulate growth.
Learning Material
If there’s one principle that separates beginners from long-term lifters, it’s progressive overload, the steady, deliberate process of asking your body to do just a little more over time.
Muscle growth and strength don’t come from doing the same workout forever; they come from challenging your body in new ways so it must adapt. This process mirrors life itself: progress comes not from giant leaps but from small, consistent increases that build resilience.
Key Insight
1. What Progressive Overload Really Means
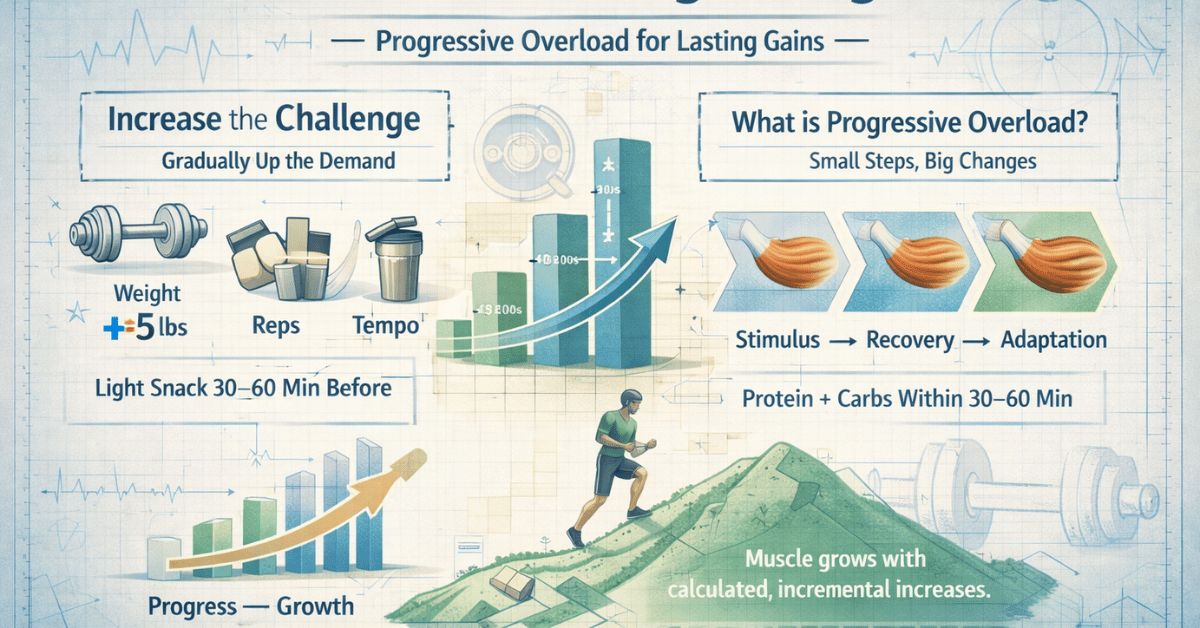
Progressive overload is the principle of gradually increasing the demand placed on your muscles to encourage strength and growth. Your body is an incredible adapter, and it learns to handle whatever stress you give it. Once it adapts, that same stress no longer feels like a challenge, and progress stalls.
To keep improving, you need to increase the workload slightly over time. This doesn’t mean lifting as heavy as possible every session; it means adjusting one or more of these factors:
- Weight: Add small increments to your lifts.
- Reps or sets: Increase the total volume of work (e.g., 3 sets of 8 → 4 sets of 8).
- Tempo: Slow down the movement to increase time under tension.
- Rest: Reduce rest time between sets to improve endurance.
- Form and control: Improve execution, better form can create more muscular engagement even without heavier weights.
Overload doesn’t always mean heavier; sometimes it means smarter.
2. The Science Behind the Strain
When you lift, your muscle fibers experience microtears. During recovery, your body repairs them, making the muscle stronger and thicker to handle future stress.
This adaptation happens through a cycle of:
Stimulus → Recovery → Adaptation.
Without progression, the stimulus plateaus, and so does growth.
Without recovery, the body never adapts properly.
A 2022 study (Plotkin et al.) compared load progression vs. repetition progression and found both strategies viable for hypertrophic adaptations.1
The body grows not during the workout, but in the space between, when given the right balance of challenge and rest.
3. Real-World Example: The 2% Rule
Imagine you’re adding just 2% more weight or intensity every week. That might not sound like much, but over 10 weeks, that’s a 20% increase in strength or endurance.
For example, if you squat 50 pounds now, adding 1 pound each week gets you to 60 pounds in 10 weeks. It’s the same principle professional athletes use: small, measurable increases to sustain long-term gains without injury.
Progress isn’t about big jumps; it’s about consistent, calculated ones.
Metaphor: The Mountain Climb
Building strength is like climbing a mountain. You don’t sprint to the top, you climb, pause to adjust, then climb again. Each step higher makes your legs burn a little more, but each pause makes you stronger for the next push.
If you try to rush the climb, you burn out or get injured. If you stop climbing altogether, your strength slips away. The secret is steady progression: one rep, one pound, one minute at a time.
My Reflection
This week, I really started to understand the importance of making progress intelligently, not impulsively. I decided to increase the weights for my leg workouts because I no longer felt any soreness, and my muscle mass hadn’t improved in a while. It’s clear that my body has adapted to my routine, which means it’s time to introduce new challenges.
Looking back, I realize that the first few weeks of this program weren’t just about physical resistance; they were about overcoming mental resistance. I had avoided strength training for a long time, not because I disliked it, but because I felt an emotional barrier to it. Cardio always felt natural to me, while resistance training felt uncomfortable and demanding. But now, that resistance is gone. What once felt intimidating has become a habit, and that, to me, is progress in itself.
I also discovered something important about emotional resistance: the only way to dissolve it is to acknowledge it. Pretending it doesn’t exist only strengthens it. Once I started journaling about my emotional reactions each day, I began noticing patterns, and understanding them helped me manage my mindset better. Accepting my emotions instead of judging them has made the process much easier.
In the past, I often pushed myself too hard, spending so much time and energy on workouts that I lost balance in other areas of my life. I’ve learned that this approach isn’t sustainable. A workout routine only has value if I can maintain it for life. My health journey doesn’t end after 100 days; it continues for as long as I live.
To make it sustainable, I need to work smarter. When I feel lost or unmotivated, I remind myself to simply start moving. Motivation often comes after I take action, not before. Even small progress counts because it means I’m still moving forward. Every rep, every workout, and every small win bring me closer to a stronger version of myself, physically and emotionally.
Biometric data
Change in Weight from Day 1: -3.8 lb,
Skeletal Muscle: 39.4 %
Muscle Mass: 94.6 lb.
Adjustment Ideas (Strategic Adjustment)
- Incremental Load: Add 1–2 lbs or one extra rep per session for key compound movements (squats, push-ups, or rows).
- Form First: Focus on perfecting your form before increasing intensity. Good mechanics are the foundation of sustainable progress.
- Rest & Recovery: Allow adequate rest days between intense sessions. Growth happens between workouts, not during them.
Note
- Daniel Plotkin et al., “(PDF) Progressive Overload without Progressing Load? The Effects of Load or Repetition Progression on Muscular Adaptations,” ResearchGate, ahead of print, August 14, 2025, https://doi.org/10.7717/peerj.14142. ↩︎