Day 23 of 100 Days Muscle Resistance Workout Challenge
Topic: Understanding Benefits of Compound Exercises (Squats, Push-ups, Rows) and Why They Recruit Multiple Muscle Groups
Learning Material
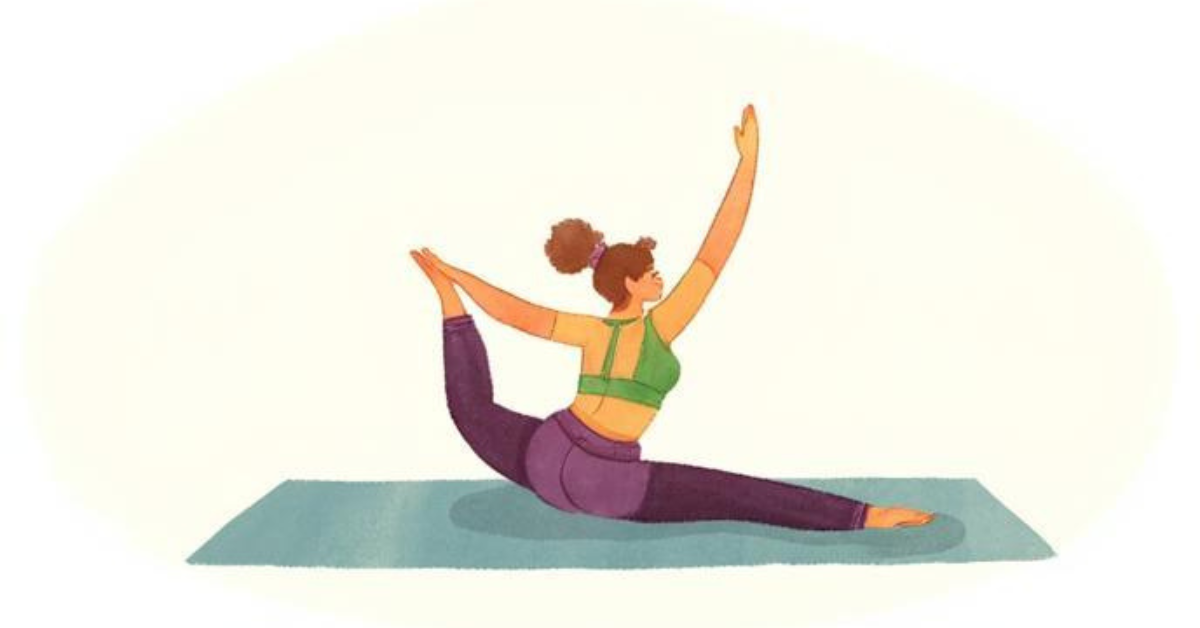
If isolation exercises are like working on one instrument, compound exercises are like leading the whole orchestra. They are movements that engage multiple muscle groups and joints simultaneously, making them cornerstones of strength, balance, and athletic performance.
These exercises are efficient, functional, and rooted in how the human body is designed to move. Whether you’re sitting down, picking up groceries, or climbing stairs, you’re performing compound actions. Training them doesn’t just make you stronger; it also makes everyday life easier.
Key Insights
1. What Are Compound Exercises?
Compound exercises involve more than one joint and several muscle groups working together.
Examples:
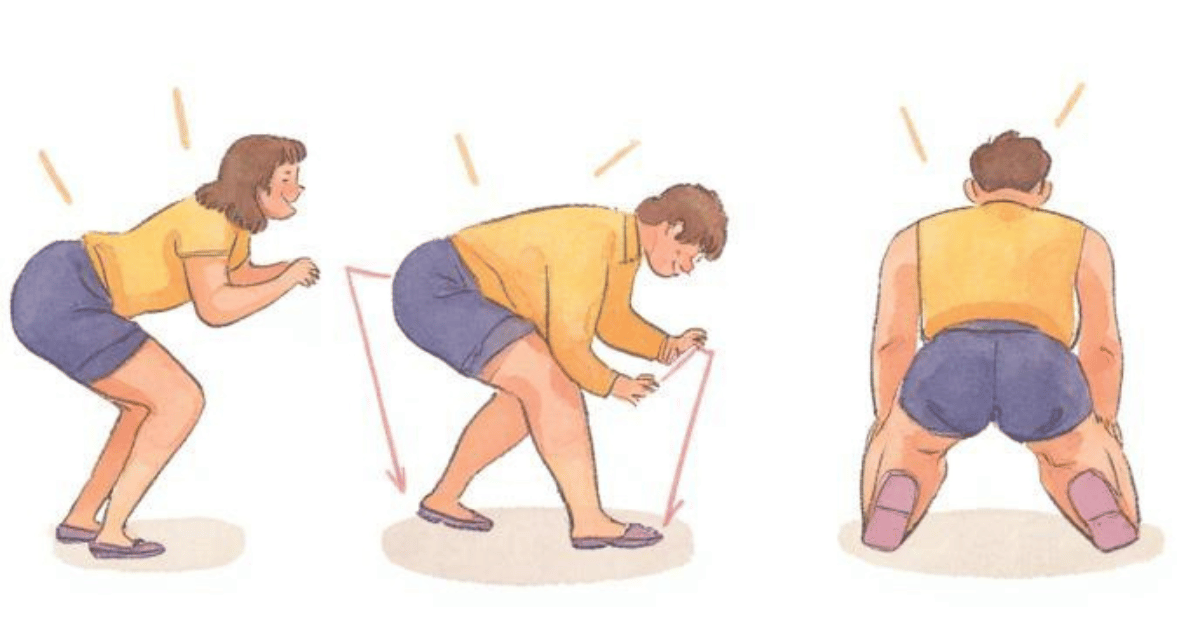
- Squat: hips, knees, and ankles (quads, hamstrings, glutes, core).
- Push-up: shoulders, elbows, wrists (chest, triceps, core).
- Bent-over row: hips, shoulders, elbows (back, biceps, core).
Because these movements coordinate several joints, they require stability, balance, and control, skills your body uses in nearly every activity.
In contrast, isolation exercises (like bicep curls) target a single joint and muscle. They are valuable for shaping or correcting imbalances, but don’t train coordination or overall power as effectively.
2. The Science Behind Compound Movements
Why do trainers and physiologists love compound exercises so much? Because they create systemic benefits, not just local muscle growth.
a. Hormonal boost:
Research shows that multi-joint exercises increase the release of growth hormone, testosterone, and IGF-1, all of which promote muscle repair and growth1. The reason? Your body interprets these exercises as a “high-stress event” requiring full-body adaptation.
b. Neural efficiency:
Your nervous system learns to recruit several muscle groups simultaneously, improving motor coordination and balance. Over time, your brain and muscles communicate more efficiently, which athletes call neuromuscular adaptation.
c. Energy economy:
Because multiple muscles fire at once, you burn more calories per minute and strengthen supporting muscles (like your core) without extra exercises.
Real-World Metaphor: The Team Lift
Imagine two people moving a heavy table. If one person tries to lift it alone (isolation), they’ll strain a single muscle group and probably fail. But if the whole team works together, each person taking a corner (compound effort), the job gets done smoothly.
Your body works the same way: when multiple muscles “team up,” the load spreads out. You become not only stronger but also more stable and less injury-prone.
Why Compound Exercises Feel So Rewarding
Compound movements activate the body and brain together. Studies show that they stimulate more oxygen flow, raise heart rate faster, and even boost endorphin release. That’s why finishing a solid set of squats or push-ups gives you that unmistakable “I did something big” feeling.
They also develop mental toughness; you can’t half-commit to a deep squat or a push-up. Every rep demands focus, control, and determination.
My Reflection
Most of my current workouts focus on compound exercises:
- Plank: engages the core, shoulders, and arms
- Squat: targets the quads, glutes, and calves
- Leg Raises: work the abs, glutes, and quads
I can feel my body getting stronger. For instance, I recently held a plank for 45 seconds, and it felt surprisingly easy. I didn’t even realize the time had passed, which tells me it’s time to increase my workout duration.
Right now, my main goal is to train larger muscle groups like my legs and abs while keeping up with cardio. I’ve been struggling a bit with weight loss, so I’ve started keeping a food journal to better track how much I eat each day. I’m also paying more attention to protein intake, making sure it’s spread evenly throughout the day. To improve sleep quality, I’ve decided not to eat anything after 5 p.m. This simple change already helps me rest better at night.
Biometric data
Change in Weight from Day 1: -2.8 lb.
Skeletal Muscle: 39.2 %
Muscle Mass: 94.6 lb.
Adjustment Ideas (Strategic Adjustment)
- Form First: Before adding more weight or reps, film or mirror your squats and push-ups. Focus on posture, depth, and balance. Compound exercises reward precision more than speed.
- Add a “Compound Starter”: Begin each session with one compound move (e.g., squats on leg day, push-ups or rows on upper-body days). It warms up several muscle groups efficiently.
- Core Engagement Habit: During all compound moves, consciously tighten your core as if bracing for a punch. This habit protects your spine and improves strength transfer through your whole body.
Notes
- Jose Vilaca-Alves et al., “(PDF) Acute Hormonal Responses to Multi-Joint Resistance Exercises with Blood Flow Restriction,” ResearchGate, ahead of print, 22 2022, https://doi.org/10.3390/jfmk8010003. ↩︎